Investigate production incidents with the evidence already in your systems.
AetherOps groups related log failures into one incident, cites every claim to a specific log line, and lists what it can't determine instead of guessing. Built for backend teams running Postgres-backed services.
We're onboarding backend teams directly — no self-serve signup yet.
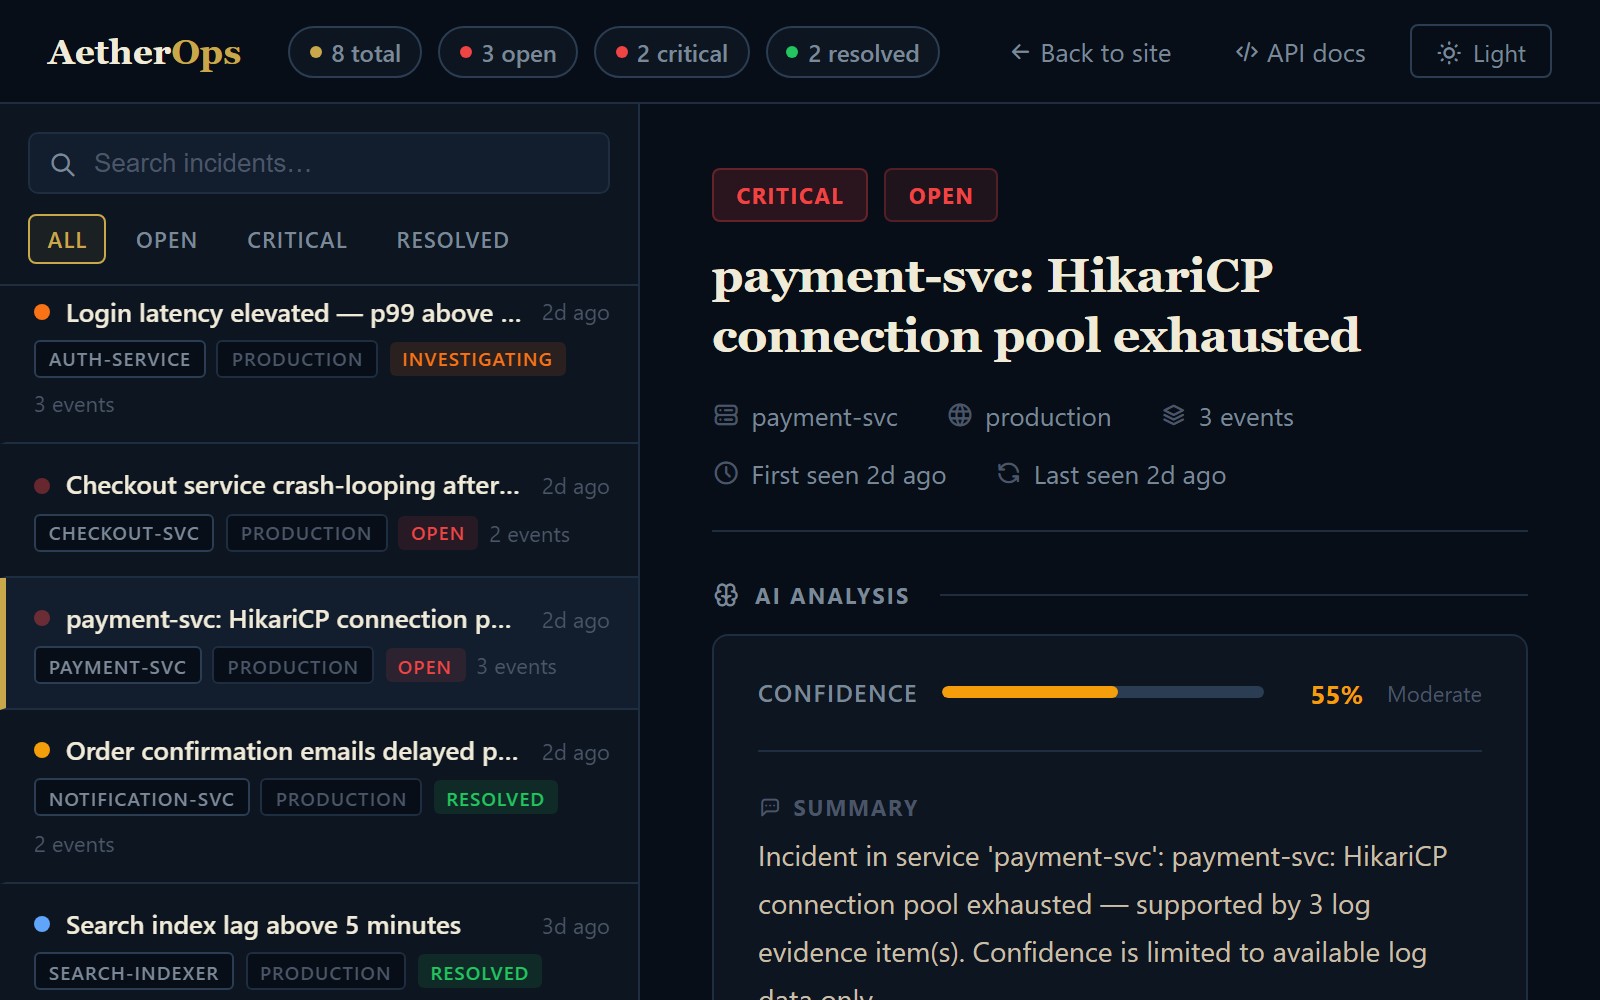
Every claim traces back to one log line
Sample incident — demo data, not a live system2026-09-14T08:12:03.441Z ERROR payment-svc HikariPool-1 - Connection is not available, request timed out after 30000ms.
This is a real screenshot of the running app — not a mockup. Seeded log events went through the actual ingestion → grouping → analysis pipeline shown below.
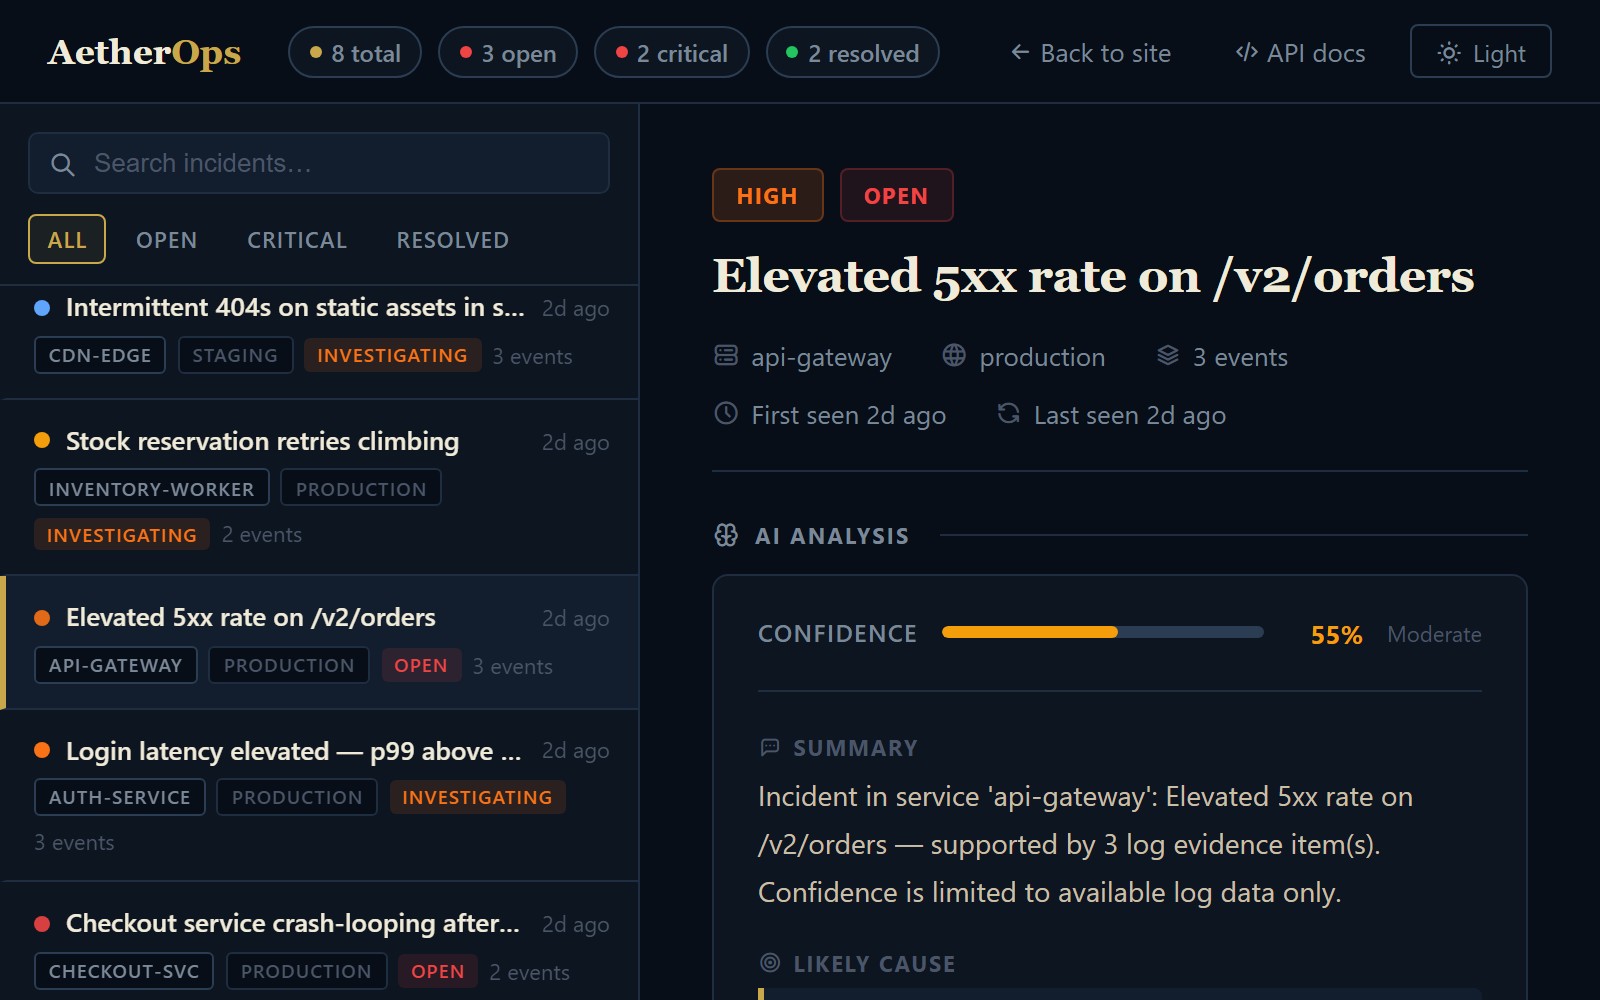
From first alert to resolved, not just the analysis screen
War rooms and on-call paging are live in the backend — Slack-linked, Twilio-paged, calendar-aware — they just don't have their own dashboard page yet, so they're shown here in the same design system rather than as live screenshots.
- Incident Commander · joined 1m ago
- Responder · joined 1m ago
- Responder · joined just now
- 1 Page primary — SMS + phone call
- 2 No ack in 5 min — escalate to secondary
- 3 No ack in 10 min — page the incident commander
One log event, followed all the way through
Same eight stages every time. Here's real data going in and what comes out the other side.
{
  "serviceId": "payment-svc",
  "level": "ERROR",
  "message": "HikariPool-1 - Connection is
    not available, request timed out
    after 30000ms.",
  "timestamp": "2026-09-14T08:12:03.441Z"
}
- ingest
- correlate
- group
- analyze
- evidence
- explain
- unknowns
- next checks
{
  "title": "payment-svc: HikariCP
    connection pool exhausted",
  "severity": "CRITICAL",
  "status": "OPEN",
  "eventCount": 3,
  "confidenceScore": 0.58
}
- ingest —
POST /api/v1/logs, API-key authenticated (SHA-256 hashed key), rate-limited per key. - correlate / group — fingerprinted by service, alert name, and severity; repeat occurrences roll into the same incident instead of creating a new one.
- analyze — evidence is passed to the analysis engine, which returns a structured, evidence-cited result (summary, likely cause, confidence, unknowns, next checks). Secrets and tokens are masked before evidence is ever stored, regardless of which analysis backend handles the request.
- evidence / explain — the returned summary and likely cause are cross-checked against cited log evidence IDs before being shown.
- unknowns / next checks — missing metrics or traces are listed explicitly; suggested checks are read-only diagnostics only.
Where incidents get reported and resolved
What's built and shipped today.
Slack (incoming webhook)
Paste your own Slack incoming webhook URL to post incident alerts — no app install required.
Jira
Create and link a Jira ticket directly from an incident, using your own Jira credentials.
ServiceNow
Create and link a ServiceNow ticket directly from an incident, using your own ServiceNow credentials.
SSO / SAML
Configure your own SAML identity provider for tenant login.
What's actually enforced
Every claim below is something you can find and read in the source, not a compliance badge.
POST /api/v1/checkout Authorization: Bearer eyJhbGciOiJIUzI1NiJ9.eyJzdWIiOiJ1c2VyXzQ0MiJ9.k3f9x7 user=442
POST /api/v1/checkout Authorization: Bearer [REDACTED] user=442
SHA-256 API keys
Raw keys are shown once at creation. Only the hash is stored.
Postgres row-level security
Every tenant-scoped table is RLS-enforced, including against the app's own database role — not just application-layer filtering.
Per-key rate limiting
Ingestion is rate-limited per API key, configurable per deployment.
Constant-time comparisons
2FA verification uses constant-time comparison, not a timing-vulnerable equality check.
Real-database test suite
Tenant isolation is tested against a real Postgres instance with RLS enforced, not mocked out.
Usage limits, not guesswork
Limits are enforced per calendar month and reset automatically. What's below is what the system actually enforces.
Configurable log retention (up to 365 days) is available on every plan and purged automatically — it isn't a paid tier feature.
- 5 AI analyses / month
- 10 runbook generations / month
- 5 postmortem drafts / month
- Incident grouping
- 50 AI analyses / month
- 50 runbook generations / month
- 25 postmortem drafts / month
- 50 incidents / month
- Everything in Starter
- Meaningfully higher monthly limits, scoped to your usage
- Priority support
- Pricing set in a direct conversation, not a fixed tier
See it against your own logs
We're onboarding backend teams directly and iterating on real feedback.